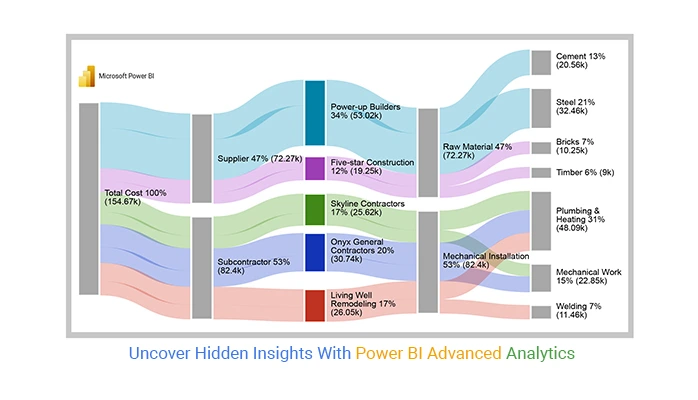
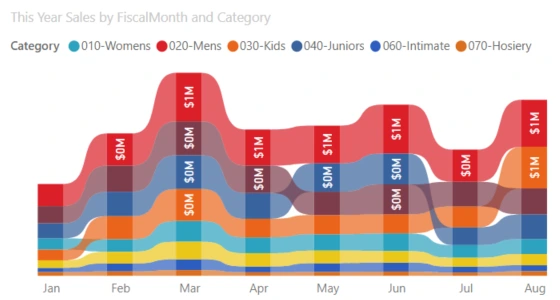
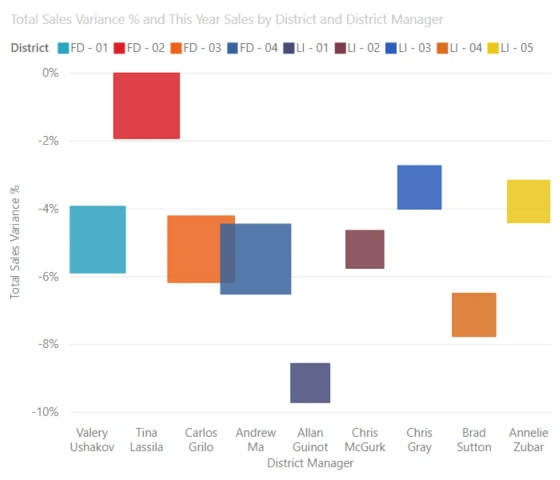
In the realm of data visualization, Microsoft Power BI stands as a beacon, offering a rich palette of tools to transform raw data into actionable insights in Data Analytics course in Sutra . Beyond the conventional charts and graphs, Power BI introduces a suite of advanced visualizations Data Analytics course in Sutra that transcend traditional boundaries. In this blog post, we will delve into the world of advanced charts in Power BI, exploring three dynamic visualizations: Animated Bar Chart Race, Drill Down Donut Chart, and Word Cloud. We’ll unravel their functionalities, showcase examples, and highlight their unique uses in extracting meaningful insights from complex datasets.

1. Animated Bar Chart Race: A Dynamic Journey through Data Trends
Functionality:
The Animated Bar Chart Race in Power BI is a visually compelling way to showcase dynamic changes in data over time. It transforms static bar charts into an animated sequence, providing a chronological narrative of evolving trends.
Example:
Consider a scenario where you want to visualize the monthly sales performance of different products. The Animated Bar Chart Race can dynamically display the rise and fall of product sales over the months, allowing stakeholders to grasp trends and identify top-performing products.
Use Cases:
- Sales Trends: Showcase the progression of sales figures for different products or regions over time.
- Population Dynamics: Visualize changes in population rankings across cities or countries.
2. Drill Down Donut Chart: Navigating Hierarchies with Precision
Functionality:
The Drill Down Donut Chart in Power BI offers an interactive way to explore hierarchical data. Users can drill down into nested levels, revealing detailed information while maintaining a visually appealing circular layout.
Example:
Imagine you have data on sales performance categorized by region, country, and product. The Drill Down Donut Chart can start by displaying sales at the regional level. Upon interaction, users can drill down to see sales by country, and further down to view sales for specific products within a country.
Use Cases:
- Geographical Analysis: Drill down from global to regional sales figures for a comprehensive view.
- Product Hierarchy: Explore sales performance by drilling down from category to subcategory to individual products.
3. Word Cloud: Turning Textual Data into Visual Insights
Functionality:
The Word Cloud visualization in Power BI transforms textual data into a visually striking representation Data Analytics course in Sutra. Words are displayed with varying sizes based on their frequency or importance, offering an immediate visual summary of textual information.
Example:
Consider a dataset containing customer feedback. The Word Cloud can visually represent the most frequently used words in customer comments, providing a glance at prevalent sentiments and concerns.
Use Cases:
- Sentiment Analysis: Visualize common words in customer reviews to gauge overall sentiment.
- Keyword Frequency: Display frequently mentioned terms in textual data for quick insights.

Advantages of Advanced Charts in Power BI:
1. Enhanced Engagement:
Advanced charts like the Animated Bar Chart Race captivate audiences with dynamic visuals, fostering increased engagement and understanding of data trends.
2. Interactive Exploration:
The Drill Down Donut Chart allows users to interactively explore hierarchical data, providing a flexible and intuitive way to navigate through complex datasets.
3. Visualizing Textual Data:
The Word Cloud transforms textual data into a visually appealing format, making it easier to identify patterns, trends, and prevalent themes.
4. Storytelling with Data:
Animated charts and drill-down capabilities enable users to tell a data-driven story, making it easier to convey insights and trends to stakeholders.

Integration of Advanced Charts in Power BI:
The integration of these advanced charts within Power BI is seamless, ensuring that users can harness their functionalities without complex configurations. Let’s briefly explore how these visualizations can be incorporated:
Adding Animated Bar Chart Race:
- Select the “Bar Chart Race” visual from the Power BI marketplace.
- Assign the time-based field for animation and the category field for ranking.
- Customize the visual appearance and settings as needed.
Implementing Drill-Down Donut Chart:
- Choose the “Drill Down Donut Chart” visual from the marketplace.
- Assign the hierarchical fields for drilling down, such as region, country, and product.
- Configure the appearance, colors, and labels for a polished presentation.
Utilizing Word Cloud Visualization:
- Add the “Word Cloud” visual from the marketplace to your report canvas.
- Assign the text field containing the textual data.
- Adjust settings such as the number of words displayed and appearance preferences.
Conclusion: Empowering Data Stories with Advanced Visualizations
In the ever-evolving landscape of data visualization, advanced charts in Power BI Data Analytics course in Sutra bring forth a new dimension of storytelling and exploration. Whether you’re tracking dynamic trends with the Animated Bar Chart Race, navigating hierarchies with the Drill Down Donut Chart, or unraveling insights from textual data with the Word Cloud, these visualizations empower users to extract meaningful insights and communicate them effectively.
As organizations strive to make data-driven decisions, the ability to leverage advanced visualizations becomes a crucial skill for analysts, business professionals, and data enthusiasts alike. The integration of these dynamic charts within Power BI serves as a testament to the platform’s commitment to providing cutting-edge tools for transforming data into actionable intelligence. So, as you embark on your data exploration journey, consider the impact that advanced charts can bring to your narratives, turning complex datasets into visual masterpieces that resonate with your audience.


