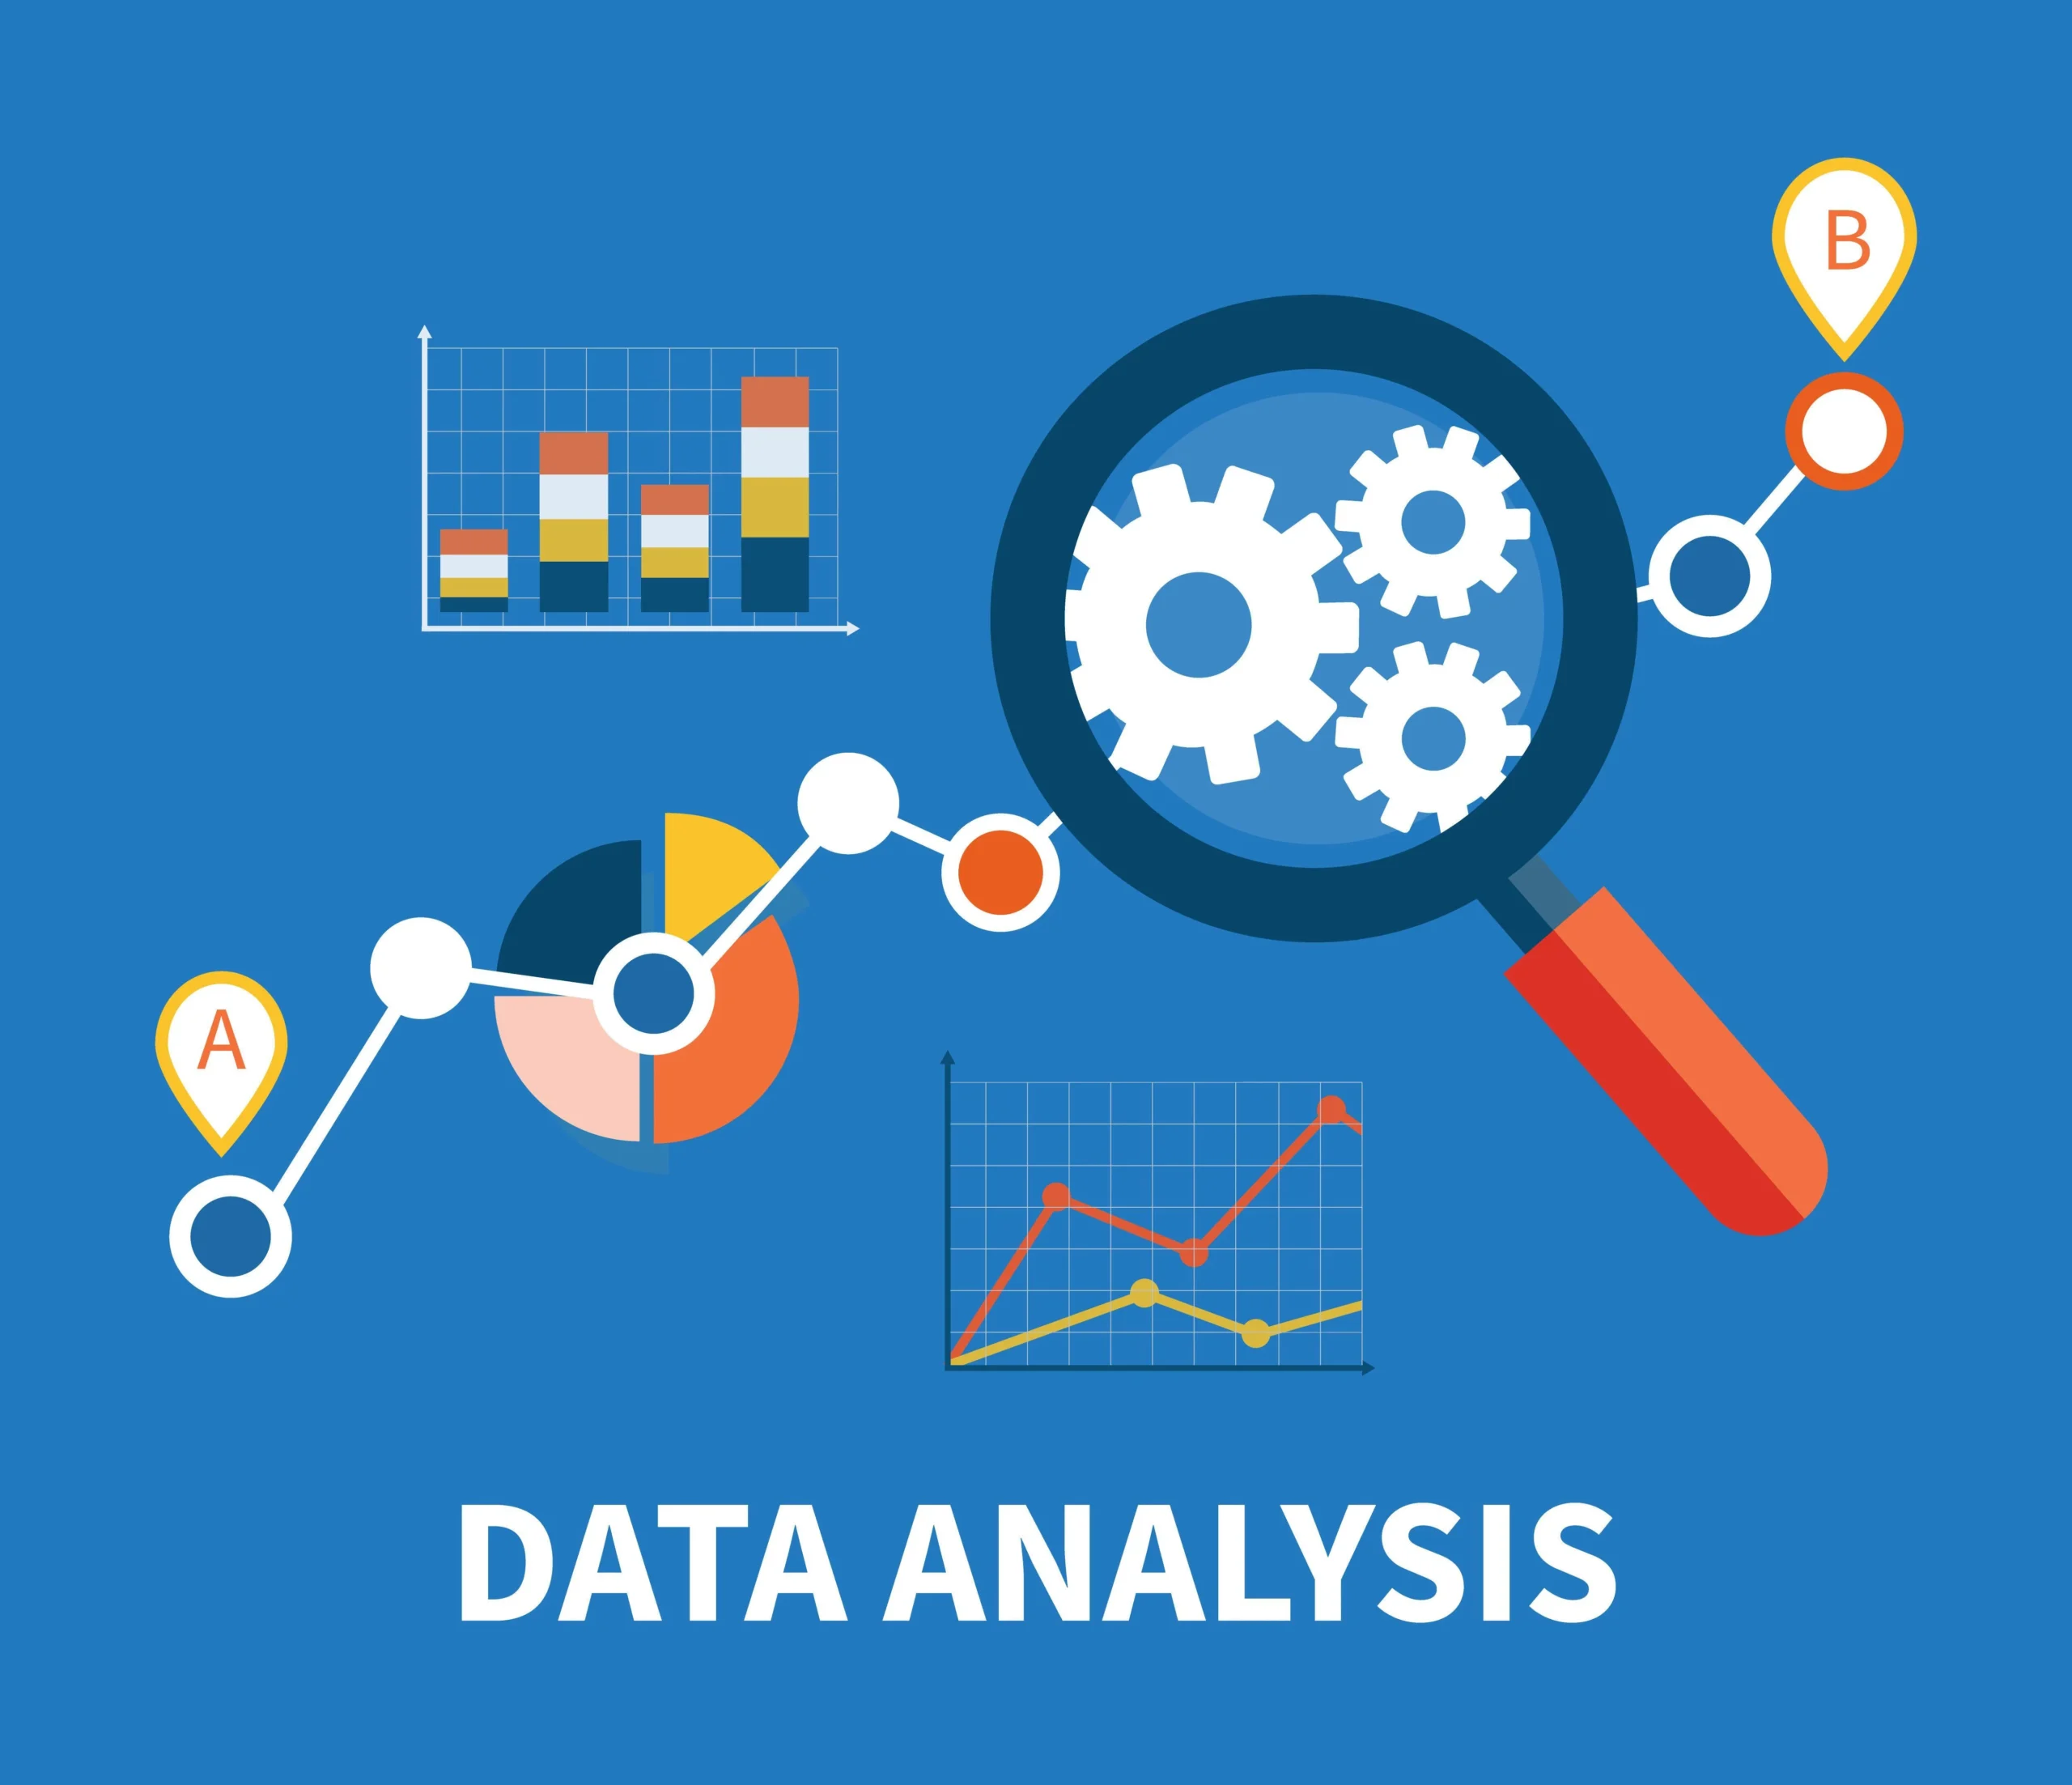
Data Analysis Course: A Comprehensive Guide
In order to find important information, draw conclusions, and aid decision-making, data analysis is a complicated process that comprises analyzing, cleaning, manipulating, and modeling data.Data analysis spans multiple facets and approaches, encompassing diverse techniques under a variety of names across various business, science, and social science domains.
In this blog post, we will take a comprehensive look at data analysis We will cover the following topics:
- What is data analysis?
- The different types of data analysis
- The tools and technologies used in data analysis course
- The steps involved in data analysis course
- The career prospects in data analysis
What is data analysis?
In order to find relevant information, assist decisions, and inform conclusions, data analysis is the process of analyzing, cleaning, manipulating, and modeling data.In several fields of business, science, and social science, data analysis has many features and methodologies, incorporating various techniques under a variety of titles.
Many different fields, including the following, use data analysis:
- Business: Businesses use data analysis to inform decisions, such as determining which products to sell, where to open new stores, and how to allocate resources.
- Finance: In the field of finance, data analysis aids in assessing risk, making investment decisions, and managing portfolios.
- Healthcare: The healthcare sector utilizes data analysis to enhance patient care, identify diseases, and develop new treatments.
- Government: Government agencies rely on data analysis to inform policy decisions, allocate resources, and combat crime.
- Education: In education, data analysis aids in improving teaching methods, evaluating student performance, and personalizing learning.
The different types of data analysis
There are many different types of data analysis, each with its own purpose.For example, some of the most common types of data analysis include:
- Descriptive statistics: Use descriptive statistics to summarize data and elucidate its main characteristics.
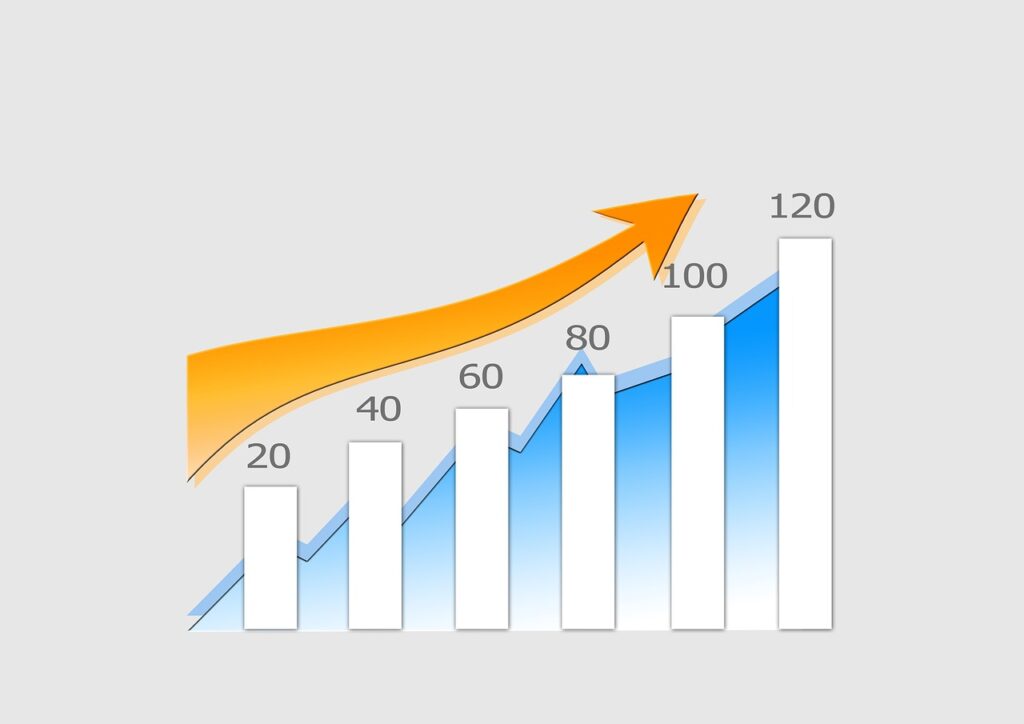
- Inferential statistics: Inferential statistics are used to make inferences about a population based on a sample.
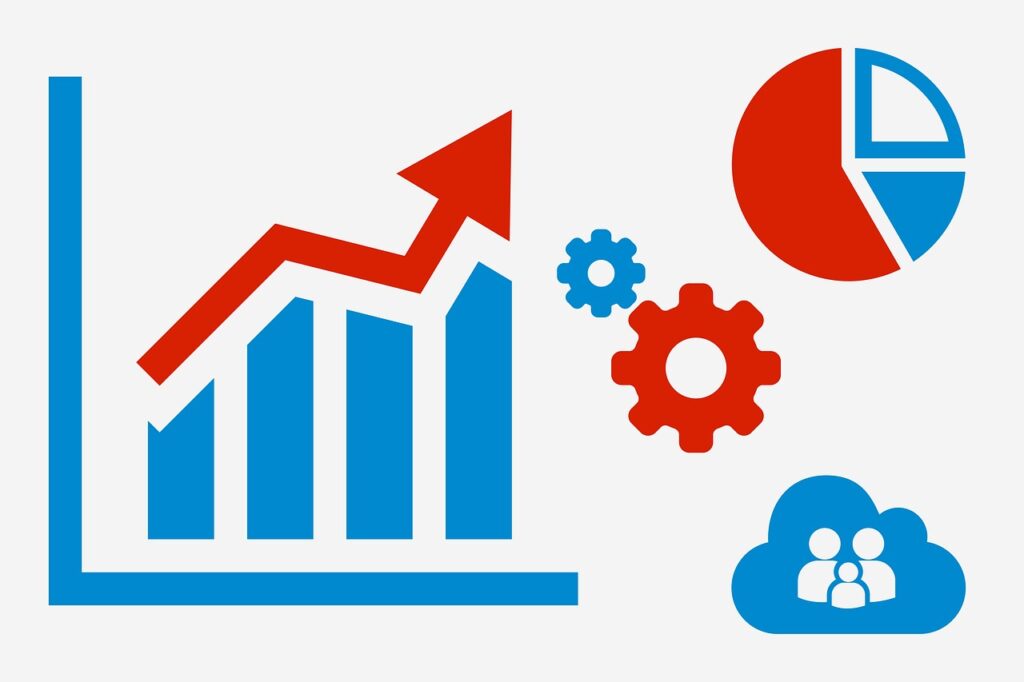
- Machine learning: Machine learning, a branch of artificial intelligence that enables computers to learn without explicit programming, is frequently used in data analysis and the construction of predictive models.Specifically, machine learning can be used to:
- Identify patterns in data that would be difficult or impossible for humans to find.Develop predictive models that can forecast future events or outcomes.Automate tasks that would otherwise be time-consuming or labor-intensive
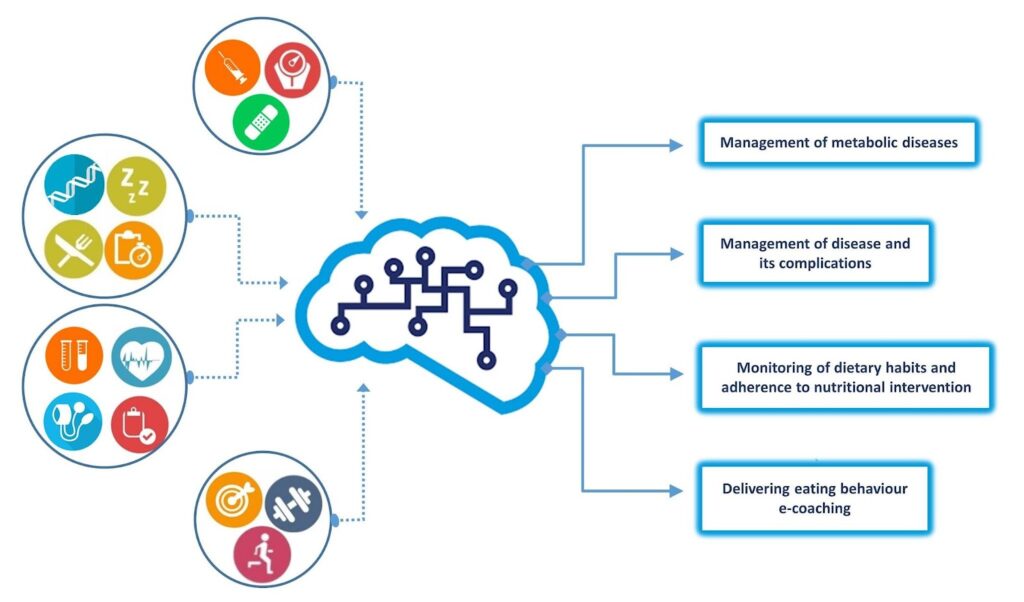
- Text analysis: Text analysis is the process of extracting meaning from text data. Text analysis can identify patterns in text, classify text, and extract insights from text
- Image analysis: Image analysis is the process of extracting meaning from image data.Specifically, it can identify objects in images, classify images, and extract insights from images
The tools and technologies used in data analysis course
There are many different tools and technologies used in data analysis. Some of the most popular tools and technologies include:
- Python: Python, a well-known computer language, is frequently used in data analysis.
- R: Data analysis frequently uses R, another well-liked programming language.
- Microsoft Excel: Basic data analysis can be conducted using Microsoft Excel, which is a spreadsheet tool.
- Tableau: It is possible to produce interactive visualizations of data using Tableau, a program for data visualization.
- Power BI: Data analysis and report creation are both possible with Power BI, a business intelligence tool.
The steps involved in data analysis course
The steps involved in data analysis can vary depending on the specific task, but they typically follow these steps:
- Data collection: The initial stage involves gathering data from various sources, such as surveys, customer transactions, or social media posts.
- Data cleaning: Following data collection, the next step is to cleanse the data by identifying and rectifying errors and inconsistencies.
- Data exploration: The third step is to explore the data. This involves looking at the data to see what patterns and trends exist.
- Data modeling: The fourth step is to create a model. This mathematically represents the data and allows for prediction.
- Data evaluation: The fifth step typically involves assessing the model’s performance by testing it with a holdout dataset.
- Data deployment: The final step is to deploy the model.This involves making the model available to users so that they can use it to make predictions.
Explore our best courses related to Graphic Designing Course
Click here and view details about Video Editing Workshop
Click here and read more about Video Editing
Diploma in Graphic Design Course
Graphic Design Course
Motion Graphic Course

