1. Introduction to User Behaviour Analytics in Digital Marketing
What is User Behaviour Tracking in Web Analytics?
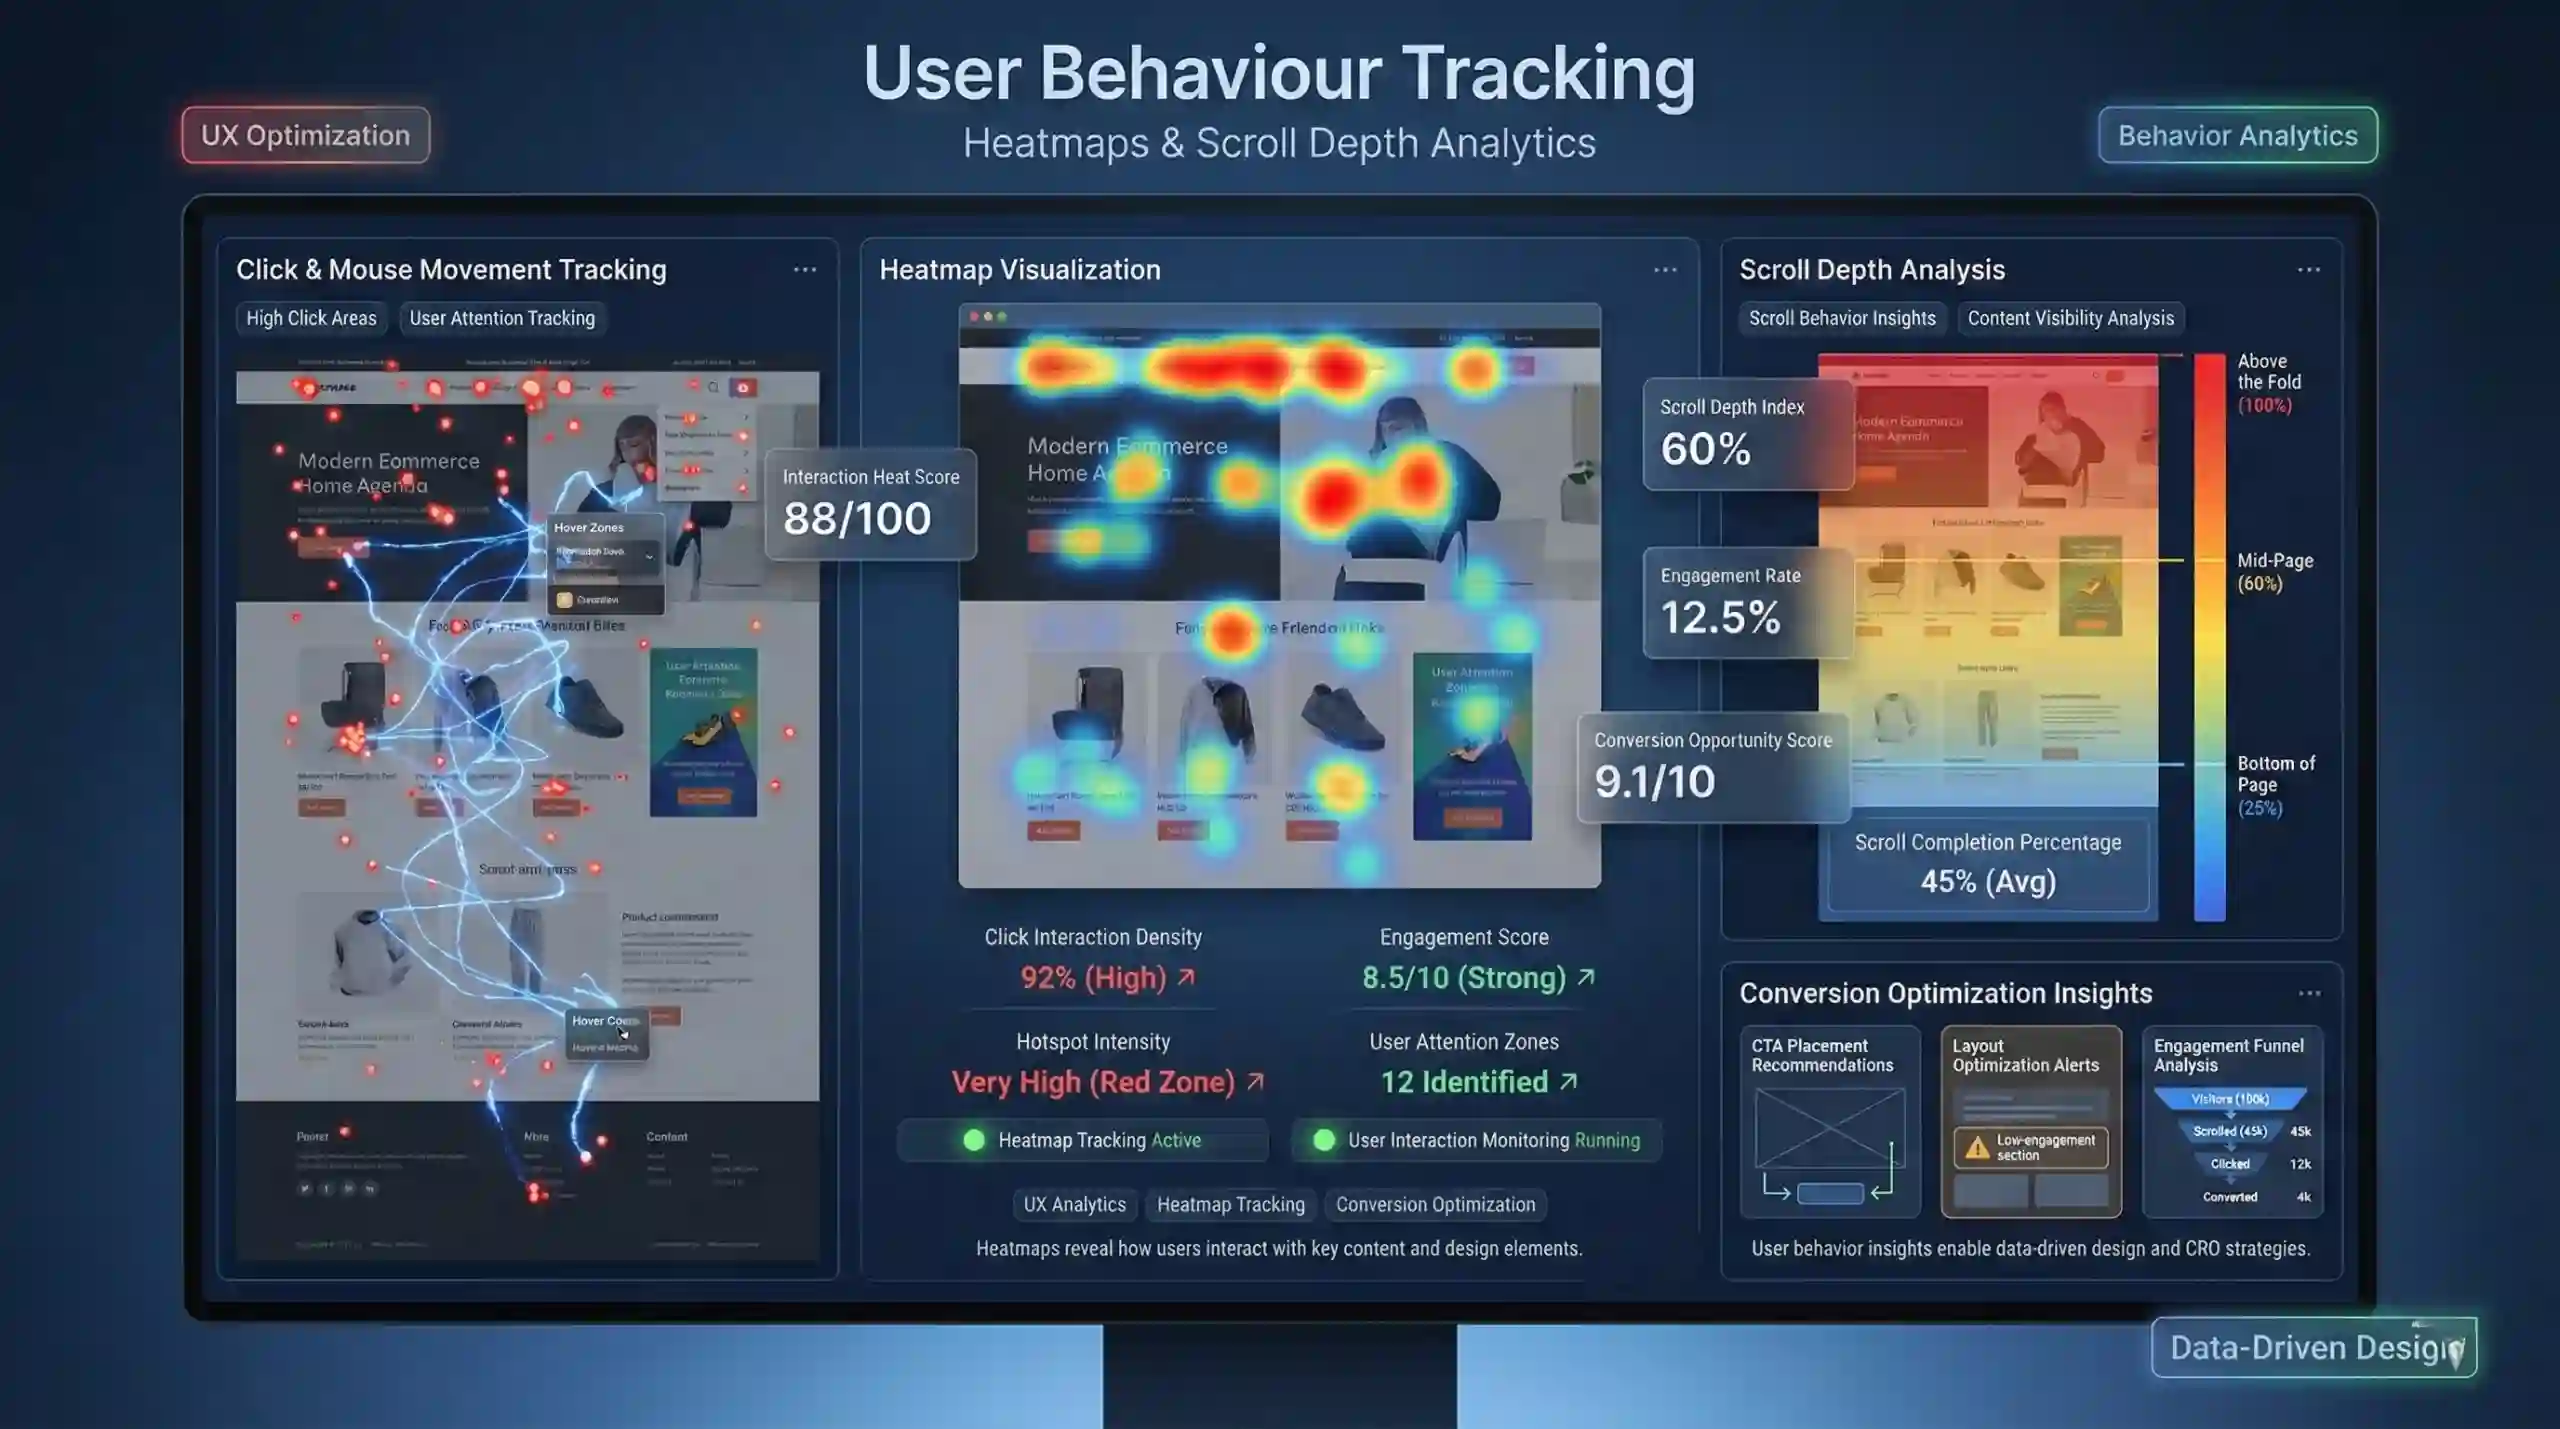
User behaviour tracking in web analytics refers to the systematic process of observing and recording how visitors interact with a website or mobile application. This includes tracking actions such as clicks, mouse movements, scroll patterns, and hover activities. The primary goal is to gain insights into user preferences, engagement levels, and navigation paths, which helps optimize website design and marketing strategies.
Real-world Example:
A fashion e-commerce website notices through heatmap analysis that most visitors hover over product images but rarely click to view details. This insight prompts the marketing team to improve product descriptions or reposition CTAs to increase conversions.
Why is User Experience (UX) Critical for Digital Growth?
A positive UX influences user satisfaction, promotes longer site visits, reduces bounce rates, and ultimately increases conversions. Understanding user behaviour data helps identify usability issues and content gaps, enabling designers and marketers to tailor websites to user preferences.
Key Tools & Technologies for Traffic & Conversion Optimization:
Tools like heatmaps, scroll depth tracking, session recordings, and click maps provide comprehensive data. These visualization tools reveal where users focus their attention and which areas are under-utilized, informing UI/UX improvements and conversion optimization strategies.
2. Understanding Heatmaps for Website Conversion Optimization
What Are Heatmaps in Web Analytics?
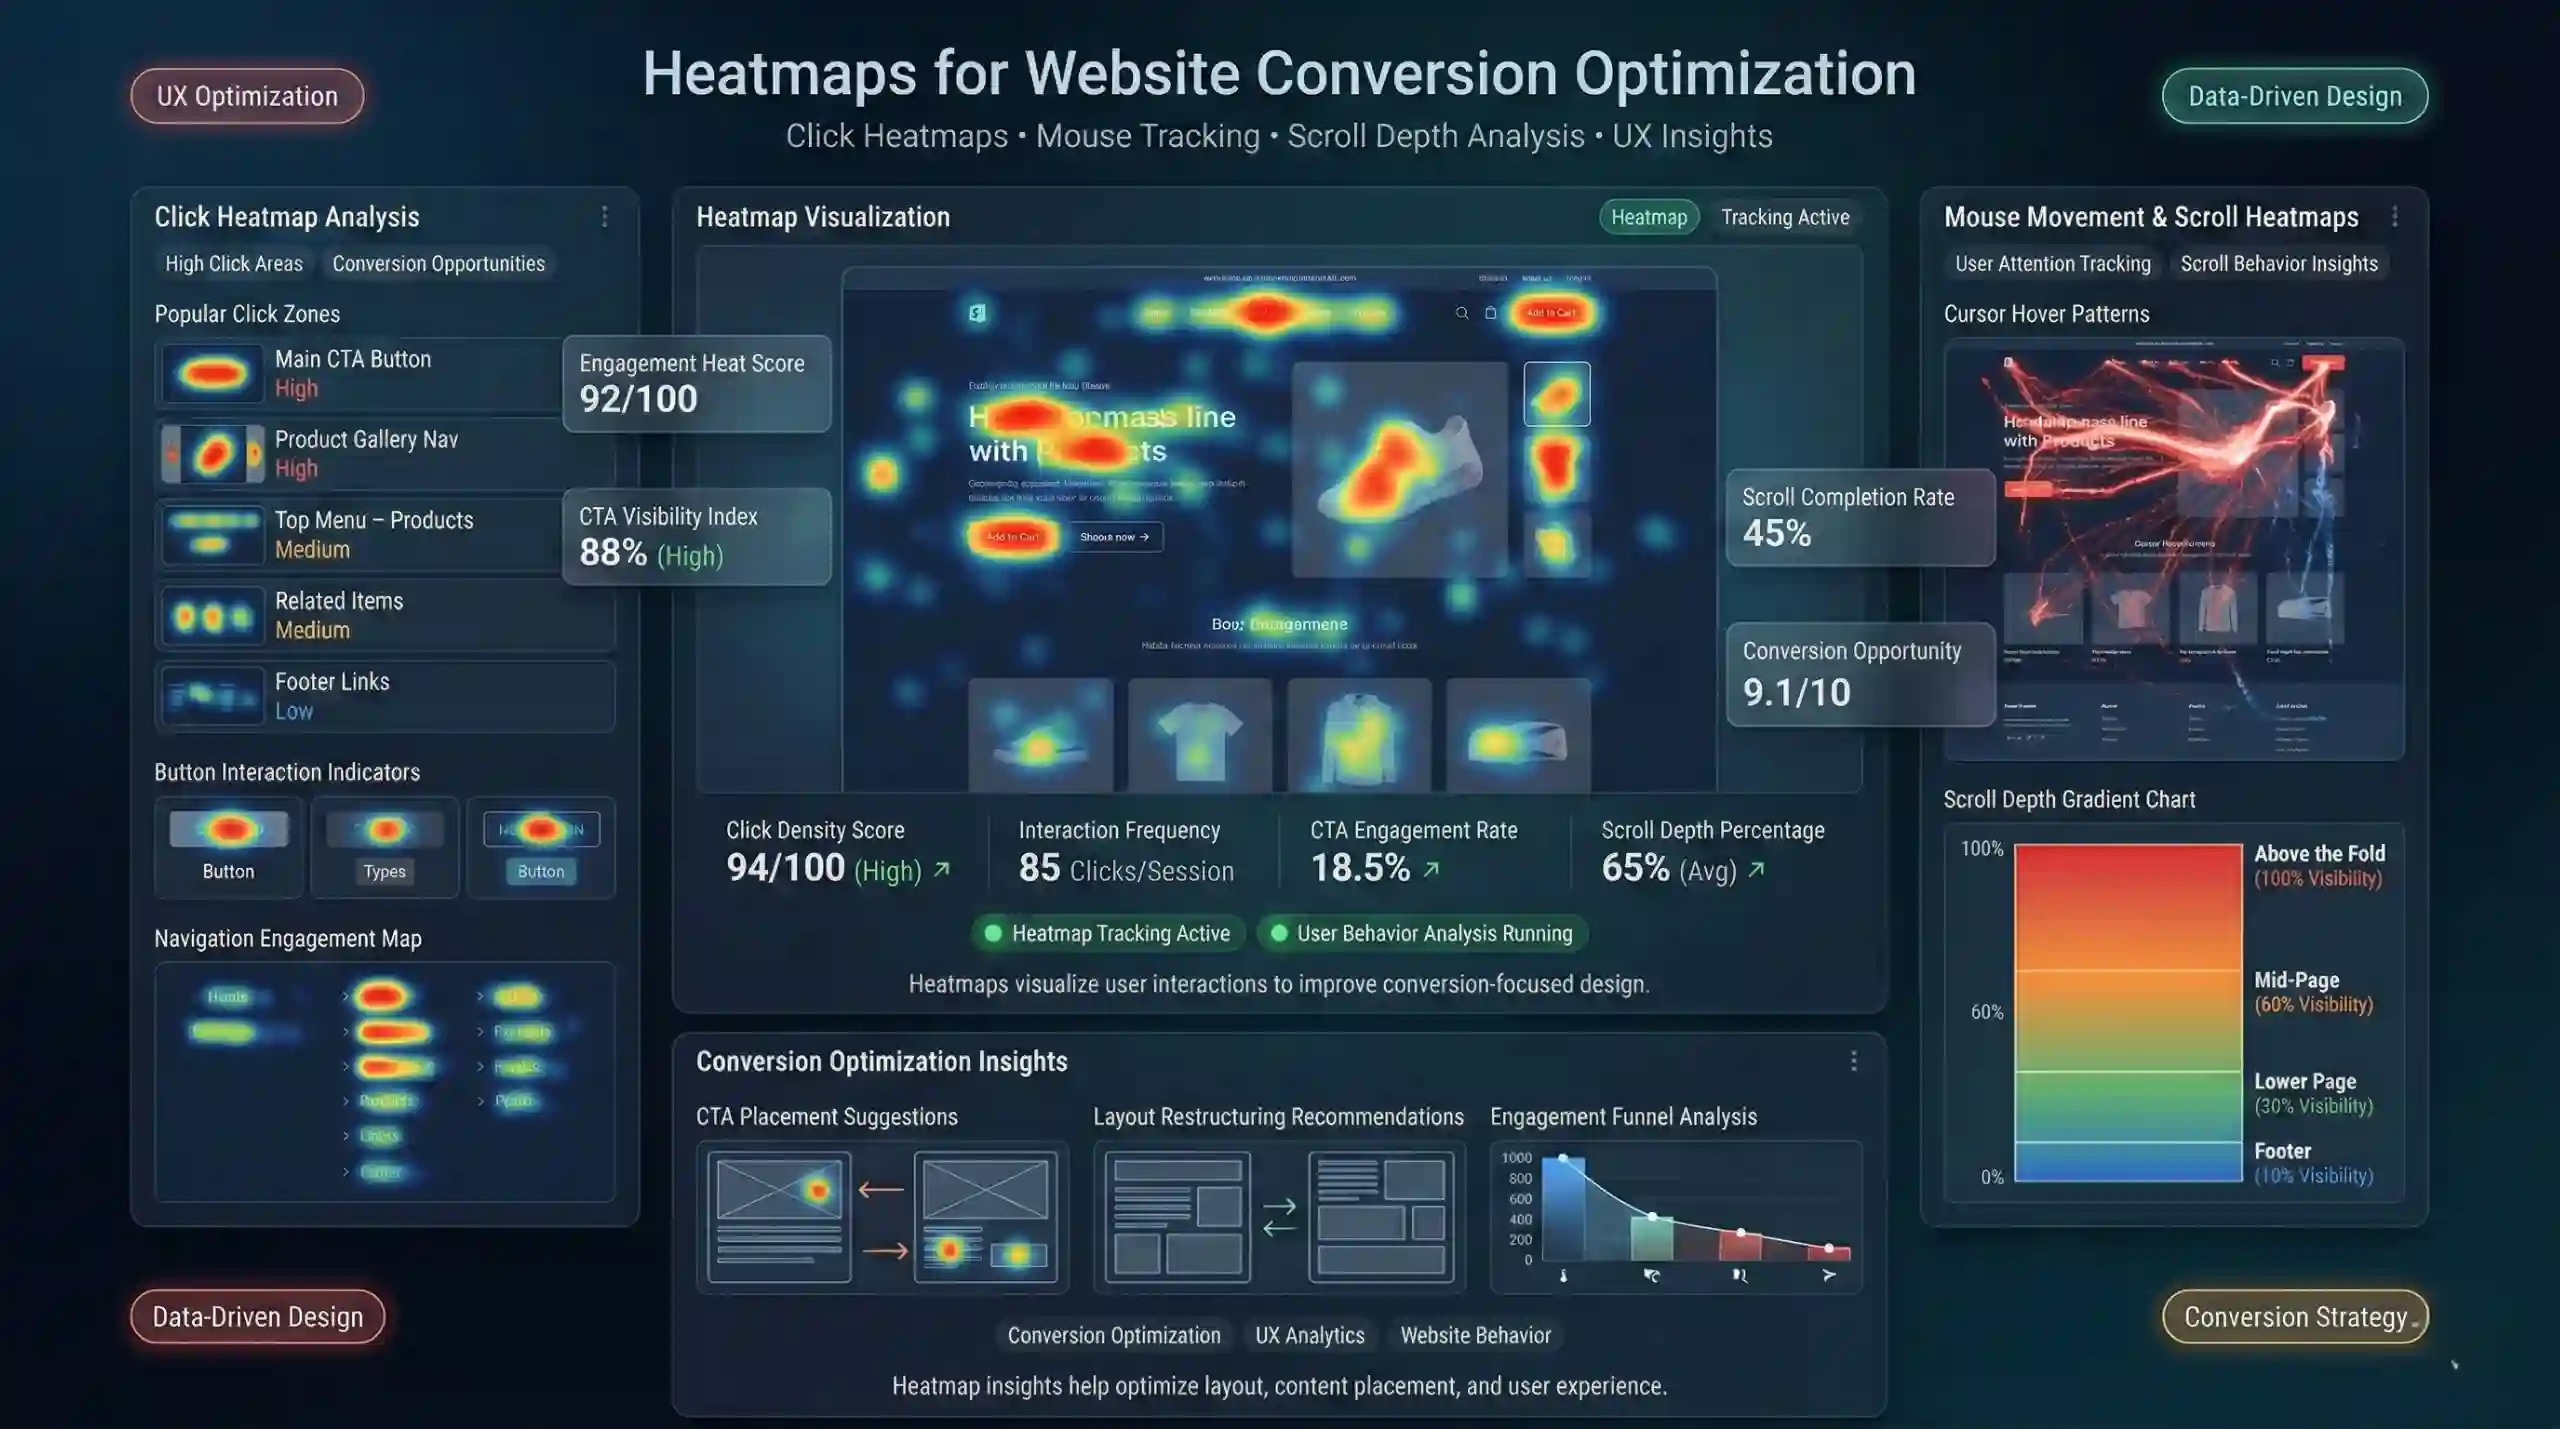
Heatmaps are visual analytics tools that overlay color-coded data on webpage layouts. Hotter colors (e.g., red, orange) indicate areas with high user interactions such as multiple clicks or extensive mouse hovering. Cooler colors (green, blue) represent areas with lesser or no activity.
Types of Web Heatmaps for Data-Driven Decision Making:
- Click Heatmaps: Display where users click most frequently, indicating popular links, buttons, or areas that attract attention.
- Mouse Movement Heatmaps: Track cursor movement and hover zones, revealing areas of user interest even if not clicked.
- Scroll Heatmaps (Scroll Depth Heatmaps): Show how far down the page visitors scroll, indicating whether important content is being seen.
Practical Example:
A landing page’s click heatmap shows most clicks occur near the top navigation bar, while the main call-to-action at the bottom receives minimal interaction. The marketer can then reposition crucial elements for better engagement.
Outcomes of Heatmap Analysis:
- Optimized placement of CTAs and key content.
- Identification of dead zones that need layout restructuring.
- Enhanced understanding of user behaviour leading to higher conversions.
3. Exploring Scroll Depth Tracking for Enhanced User Engagement
What Is Scroll Depth Tracking in Website Analytics?
Scroll depth tracking measures the vertical progress of visitors as they navigate through webpage content. It captures the percentage or pixel point at which users stop scrolling, providing insights into content engagement levels.
Why Is Scroll Depth Tracking Vital for Digital Marketers?
By understanding how far down users scroll, marketers can verify if critical information or conversion prompts are viewed. It aids in assessing content relevance and webpage length, informing decisions to improve layout or content positioning.
Types of Scroll Depth Metrics for Website Optimization:
- Vertical Scroll Percentage: Tracks how many users reach specific thresholds such as 25%, 50%, 75%, and 100% of the page length.
- Time Spent in Sections: Measures the duration users spend exploring different sections, indicating their interest level.
Example:
A blog article’s scroll depth data reveals most readers only reach 50% before abandoning the page, suggesting content may be too lengthy or unengaging. The marketer can then consider truncating or restructuring the content.
4. Implementing Heatmap & Scroll Depth Tracking Tools
How to Integrate Heatmaps & Scroll Depth Analytics in Your Website:
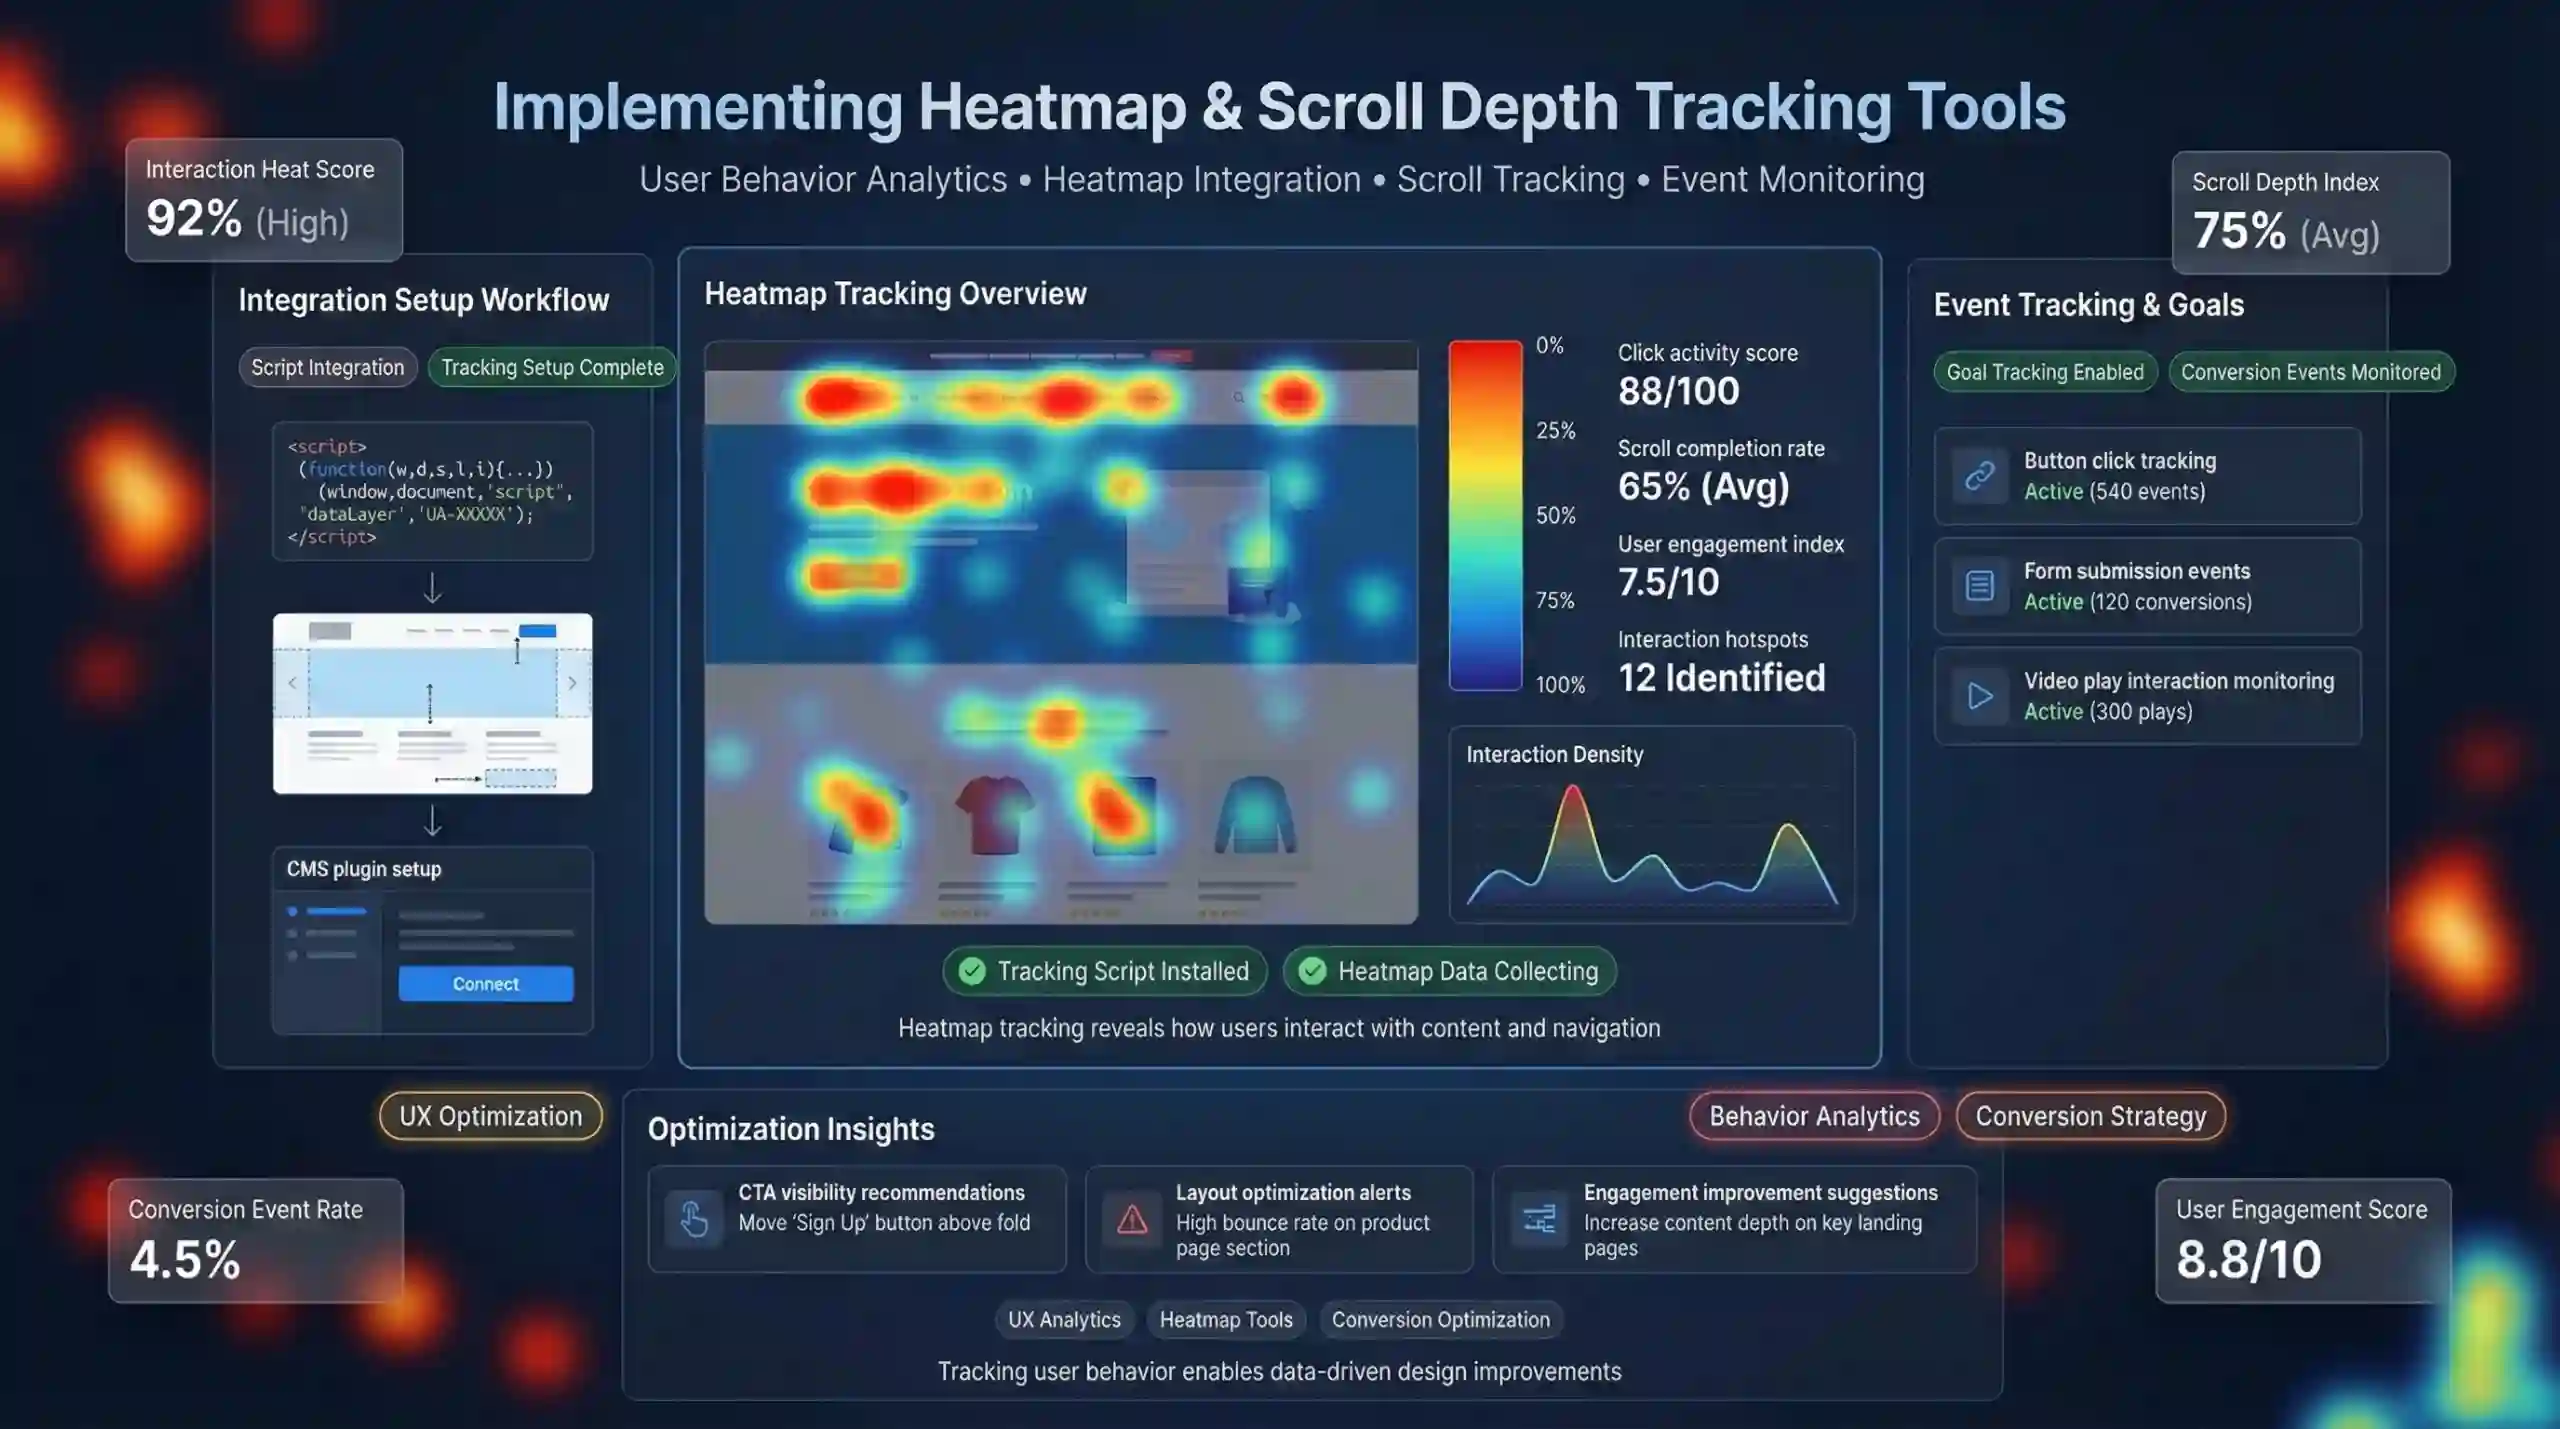
Integration involves selecting a suitable user behaviour analytics (UBA) tool—such as Hotjar, Crazy Egg, or Mixpanel—and installing it onto your website. Typically, this requires adding a JavaScript snippet into your website’s header or footer. For content management platforms like WordPress, plugins facilitate easier integration.
Setup Example (using Hotjar):
<!-- Hotjar Tracking Code -->
<script>
    (function(h,o,t,j,a,r){
        h.hj=h.hj||function(){(h.hj.q=h.hj.q||[]).push(arguments)};
        h._hjSettings={hjid:YOUR_HOTJAR_ID,hjsv:6};
        a=o.getElementsByTagName('head')[0];
        r=o.createElement('script');r.async=1;
        r.src=t+h._hjSettings.hjid+j+h._hjSettings.hjsv;
        a.appendChild(r);
    })(window,document,'https://static.hotjar.com/c/hotjar-','.js?sv=');
</script>
Replace YOUR_HOTJAR_ID with your account ID.
Setting Goals & Tracking Events:
Define actions such as clicks on specific buttons, form submissions, or video plays to measure how effectively visitors engage with your content.
5. Data Analysis & Interpretation for Modern Digital Marketing
How to Read & Utilize Heatmaps in Website Optimization?
Interpret heatmaps to identify zones with high interactions. For example, focus on redesigning areas with minimal clicks to enhance usability. High-interest zones can be reinforced with prominent CTA buttons or targeted content.
Analyzing Scroll Depth Data for Content Strategy:
Examine how many users scroll through different sections. If key messages are above the fold but not seen by most visitors, consider repositioning content or reducing page length. For long-form pages, increasing engagement can involve breaking content into smaller sections.
Making Data-Driven Website Improvements:
Regularly review insights and conduct A/B tests to refine layout changes. Incorporate mobile-specific heatmaps due to device diversity, ensuring optimal performance across platforms. Continuous experimentation and analysis lead to higher user satisfaction and conversion rates.
6. Best Practices & Tips for Effective User Behaviour Tracking
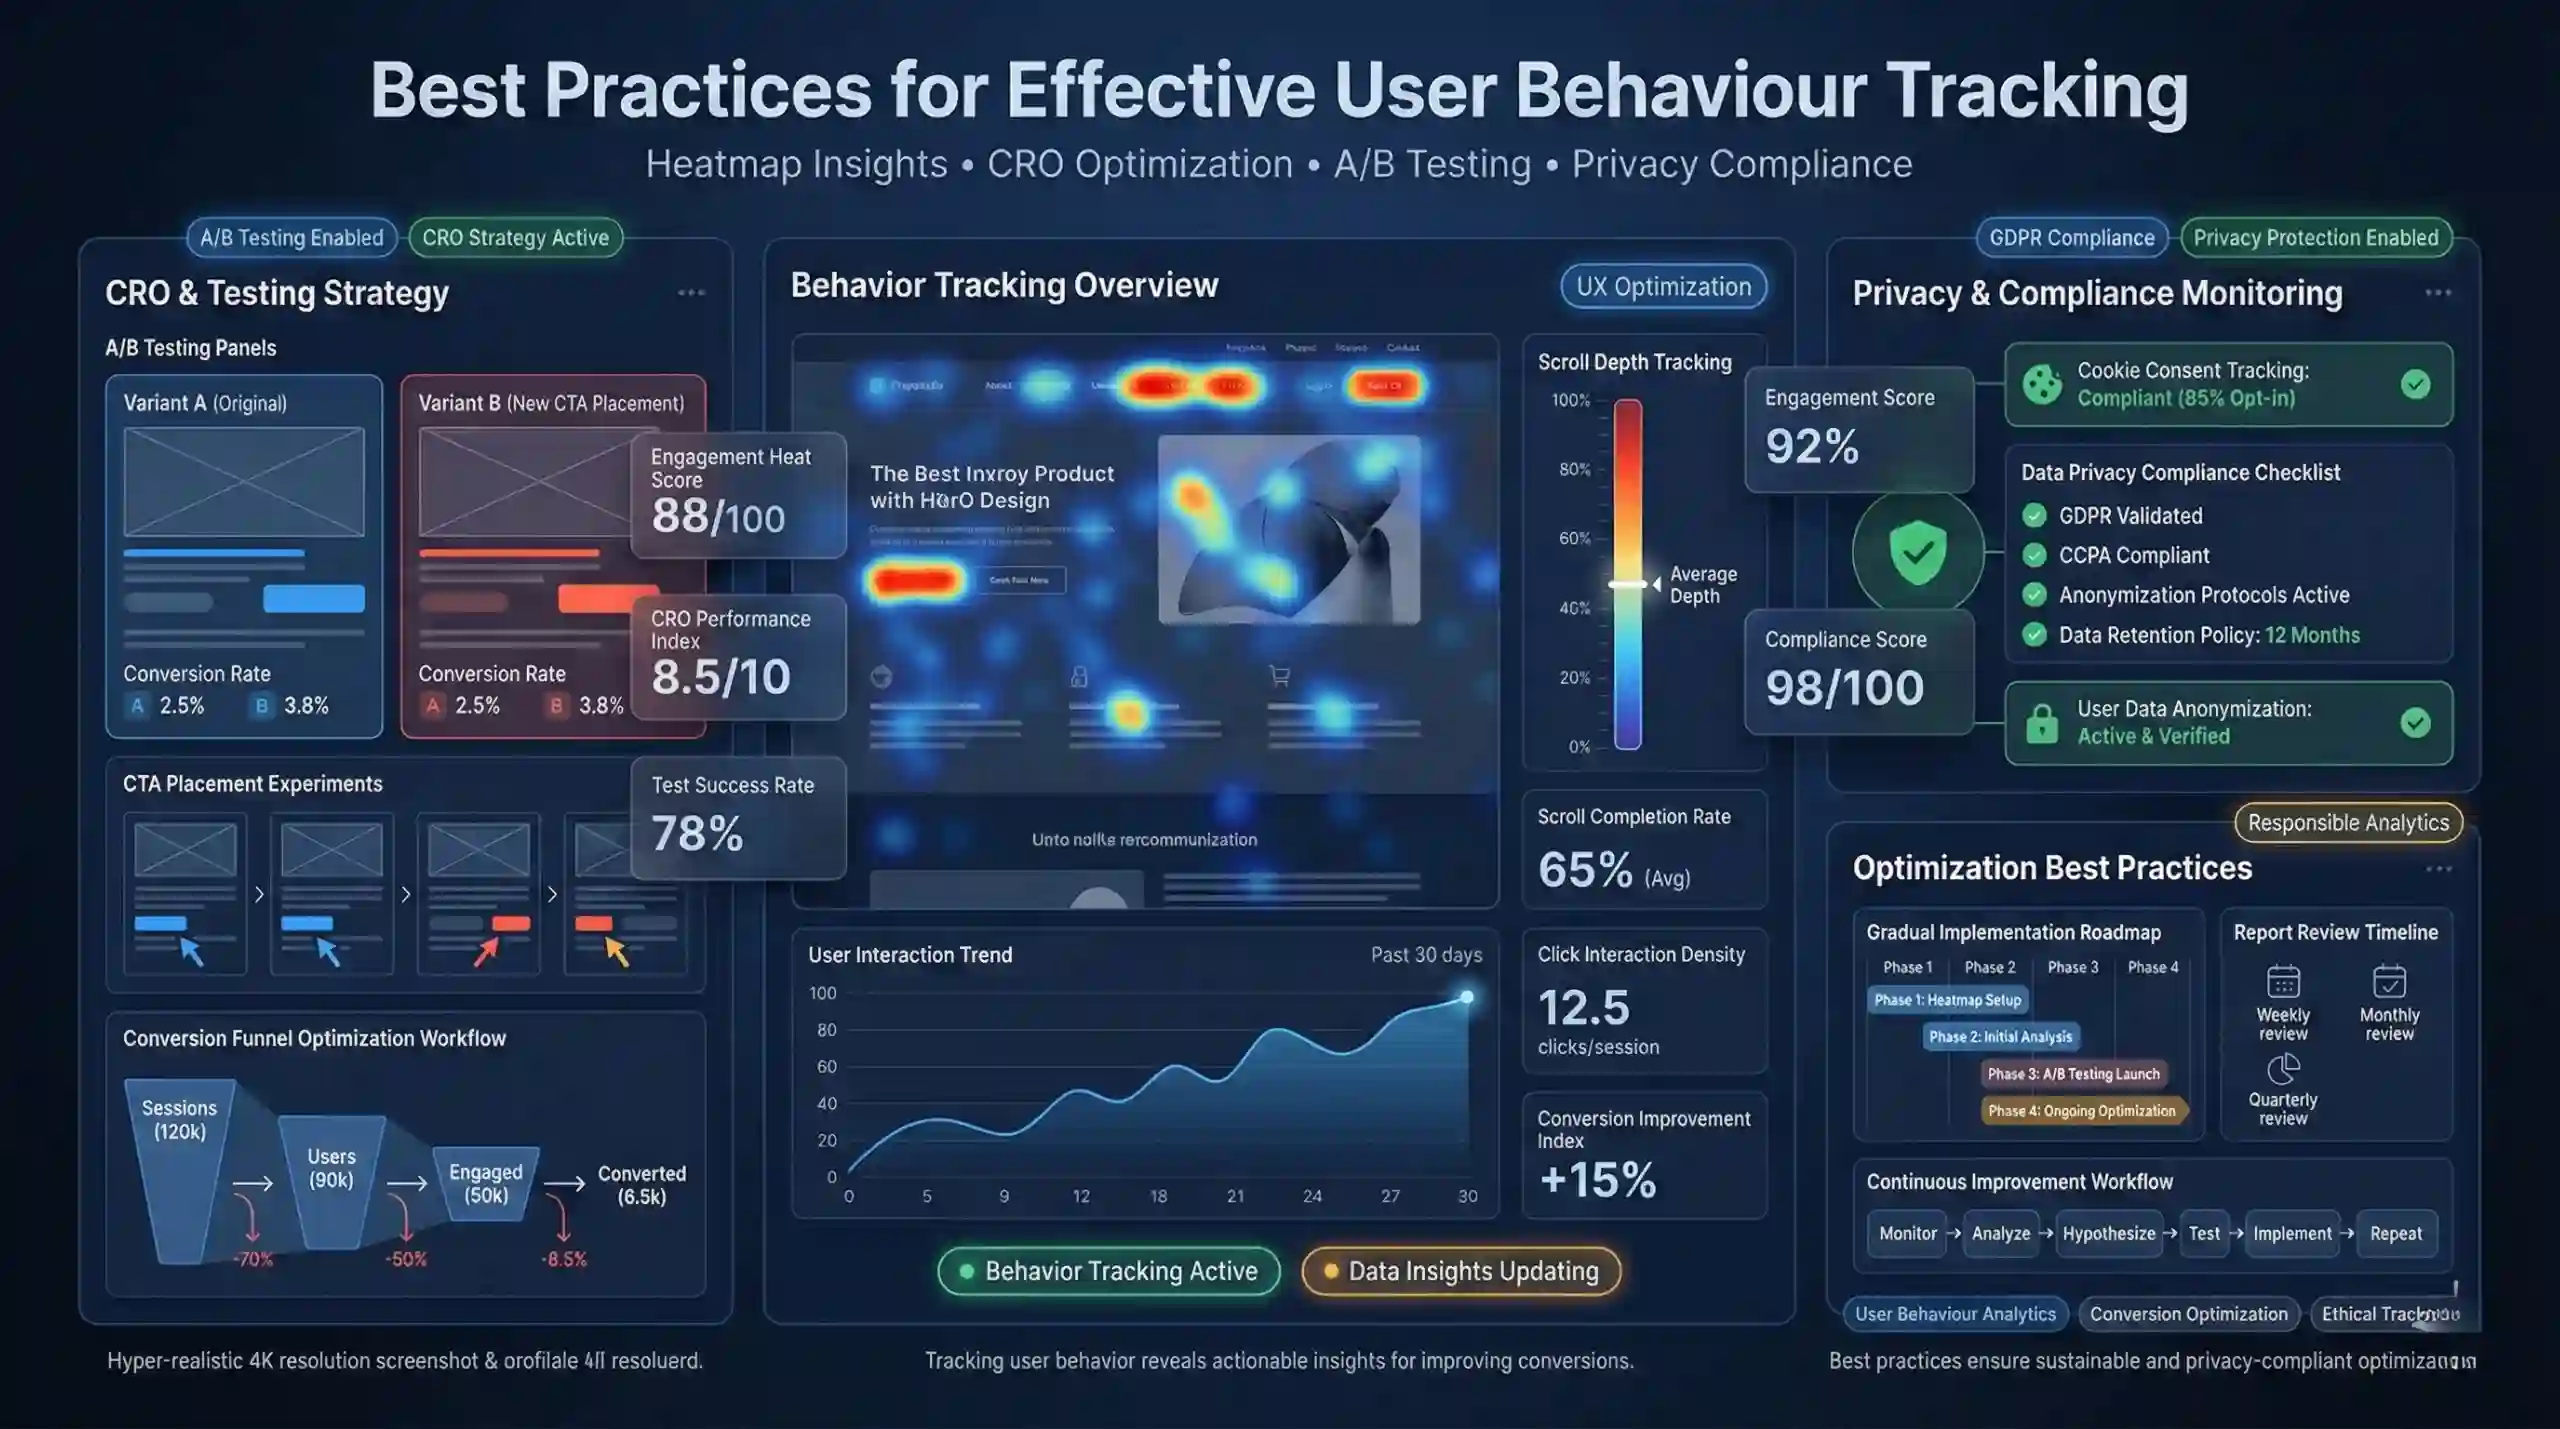
- Start Small & Scale Gradually: Begin with essential heatmap and scroll tracking tools, then expand coverage as familiarity increases.
- Regularly Review and Update Reports: Set periodic reviews to catch trends, seasonal patterns, and emerging issues.
- Leverage Insights for Conversion Rate Optimization (CRO): Use collected data to test different designs or content strategies via A/B testing to identify the most effective elements.
- Prioritize User Privacy & Regulatory Compliance: Ensure compliance with GDPR, CCPA, and cookie policies by informing users and handling data responsibly.
7. Additional Resources & Beginner-Friendly Tutorials
Platforms & Tutorials:
Educational Courses:
- Udemy courses on web analytics and heatmaps.
- Coursera specialization on digital marketing analytics.
Case Studies & Blogs:
Review case studies demonstrating successful website improvements driven by heatmap and scroll depth analytics.
Summary
Understanding and implementing heatmaps and scroll depth tracking are fundamental skills in website user behaviour tracking and digital marketing. These tools enable you to interpret visitor interactions visually, optimize website layout, enhance user engagement, and increase conversion rates. Starting with beginner-friendly analytics platforms, interpreting data accurately, and continuously refining your website based on insights will support sustained digital growth.
More Courses
- Social Media Marketing course with Gen AI
- Advance Digital Marketing & SEO course with Gen AI
- Advanced Certificate in Digital Design & Marketing course with Gen AI
- Meta & Google Ads course with Gen AI