
If you’ve ever needed to break down Excel data based on multiple conditions, then listen up… You’re sitting on a goldmine of built-in Excel power. Two of the most essential tools for data analysis—COUNTIFS and SUMIFS in Excel—are right under your fingertips. Whether you’re learning COUNTIFS in Excel to analyze records or using SUMIFS in Excel to calculate totals with multiple criteria, these advanced Excel formulas are must-have skills for professionals. Master them with advance Excel classes near me or enroll in an advance Excel course in Surat to level up your data analysis skills.
But what happens when you combine both? You get one of the most efficient, dynamic, and data-smart analysis systems you can build — without macros, without complex formulas, and without external tools. Let’s walk through, step-by-step, how to use COUNTIFS and SUMIFS together to make your spreadsheets faster, cleaner, and 100% smarter.
First: Understand the Functions Separately
✅ What is COUNTIFS()?
Counts how many rows match multiple criteria.
=COUNTIFS(range1, criteria1, ...)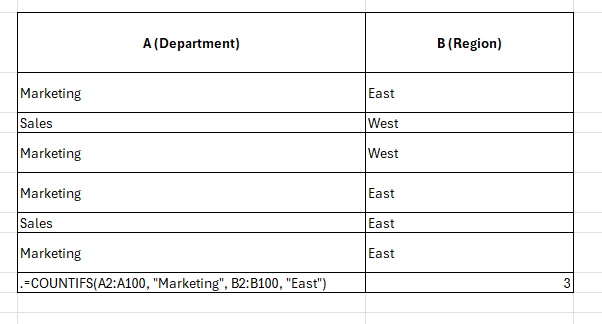
✅ What is SUMIFS()?
Sums values only when multiple conditions are met.
=SUMIFS(sum_range, range1, crit1, ...)
Real-World Scenario: Sales Performance Report
Let’s say you manage a national sales team. Here is your raw data:
| Dept (A) | Region (B) | Rep (C) | Revenue (D) |
|---|---|---|---|
| Marketing | East | Alice | $5,000 |
| Sales | West | Bob | $3,000 |
| Marketing | East | Charlie | $4,000 |
| Sales | East | Alice | $3,500 |
🎯 Your Task: Calculate how many Marketing records came from the East region, and the total revenue from those specific rows.
✅ Step 1: Count Records
=COUNTIFS(A2:A6, "Marketing", B2:B6, "East")Result: 2 (Two records match both conditions)
✅ Step 2: Sum Revenue
=SUMIFS(D2:D6, A2:A6, "Marketing", B2:B6, "East")Result: $9,000 ($5000 from Alice + $4000 from Charlie)
Why Use Both Together?
In dashboards and reports, you often want to show counts and totals side by side — to compare how many times something happened vs. how much it added up to.
| Metric | Formula | Result |
|---|---|---|
| Number of Marketing entries in East | =COUNTIFS(A2:A6, “Marketing”, B2:B6, “East”) | 2 |
| Total revenue from those entries | =SUMIFS(D2:D6, A2:A6, “Marketing”, B2:B6, “East”) | $9000 |
Combine with Cell References (Dynamic Dashboard Style)
Hardcoding values like “Marketing” is fine for learning, but for a pro dashboard, use cell references. If F1 is your Department dropdown and F2 is your Region dropdown:
- Count: =COUNTIFS(A2:A6, F1, B2:B6, F2)
- Sum: =SUMIFS(D2:D6, A2:A6, F1, B2:B6, F2)
Now, every time the user updates F1 (Dept) or F2 (Region), your metrics refresh instantly.
Bonus Use Case: Calculate Average Revenue per Match
Want to calculate the average revenue per matching record?
=SUMIFS(...) / COUNTIFS(...)If your sum is 9000 and count is 2 → Result = 4500. Now you’re not just tracking how many and how much, but how well.
Filter by Rep, Region, Date – As Many as You Want
You’re not limited to 2 criteria. Let’s say you have a Date column (E) and want total revenue from Marketing in East on 2024-06-01.
=SUMIFS(D2:D6, A2:A6, "Marketing", B2:B6, "East", E2:E6, DATE(2024,6,1))⚠️ Common Mistakes (and How to Avoid Them)
1. ❌Mismatched Range Sizes:
criteria_range and sum_range must be the exact same length (e.g., A2:A100 vs D2:D100).
2. ❌Forgetting Case Sensitivity:
“East” and “east” are treated the same. For case-sensitive checks, you need SUMPRODUCT or ARRAYFORMULA.
3. ❌Division by Zero:
When calculating averages manually, always check if COUNTIFS is not zero: =IF(COUNTIFS(...)=0, "No data", ...)
COUNTIFS vs. SUMIFS vs. AVERAGEIFS
| unction | What It Does | When to Use |
|---|---|---|
| COUNTIFS | Counts rows matching multiple conditions | When you want quantity |
| SUMIFS | Adds values matching conditions | When you want totals |
| AVERAGEIFS | Averages values based on multiple filters | When you want performance insights |
Final Words: This Duo is a Data Power Move
By using COUNTIFS and SUMIFS together, you’re building interactive dashboards and analyzing not just raw numbers, but actionable insights. You become a spreadsheet ninja without writing a single line of code.
Master Data Analytics in Surat
Ready to move beyond basic tables and build fully interactive dashboards? Explore the advanced data analytics courses offered by Future Vision Computer Institute.
Find Our Locations
Visit any of our three convenient branches or contact us directly.
Pal Branch
Address: 115, Raj Victoria Complex, Pal Gam Circle, Pal.
Phone: +91-9825771641
Conclusion
COUNTIFS and SUMIFS are your go-to tools for smart, efficient Excel analysis. Used together, they turn raw data into clear insights — fast. Master these functions, and your Excel game isn’t just strong — it’s pro-level.